Tirzepatide in SURMOUNT: what symptom-group averages leave unanswered
A reported symptom can define a subgroup without making that subgroup a randomized comparison.
AI-assisted editorial analysis of public research. This article has not received independent human medical review. It does not evaluate a provider’s clinical care.
Two averages can be easy to compare and difficult to interpret. Before asking which is larger, it helps to ask what created the groups, which measurements entered the calculation and which question the result answers. These choices determine whether a comparison describes an association, supports a prediction or helps explain a mechanism.
Suppose a hypothetical report gives an average for a smaller group and an average for a larger group. What would an average for everyone mean? Giving each group equal weight answers a question about the average of the two group summaries. Giving each person equal weight requires the group sizes to enter the calculation. Those operations generally answer different questions, even when neither reported group average changes. For ordinary arithmetic means of the same outcome, measured on the same basis in separate groups covering the intended population, weighting by group size recovers the overall mean. Change the target population, and the appropriate weights may change too. Now imagine that the summaries were standardized through a model to a common reference population. Their construction matters: they are no longer automatically interchangeable with raw group means. Before combining them, a reader would need to know which population each estimate represents, how standardization was performed and whether the proposed weights preserve that target. The scientific question is therefore about both the values being averaged and the population the average is meant to describe.
Interpretation at a glance
- Group formation. A later classification needs its own causal argument. [2]
- Information compression. An indicator can conceal distinct sequences. [2]
- Target question. An estimate needs a defined outcome horizon. [2]
- Model assumptions. An estimated value is not a recovered observation. [2]
- Equivalence. Visual proximity does not establish a negligible difference. [2]
The word with hides a research decision
A comparison described as with symptoms versus without symptoms sounds like a comparison between two treatments. Logically, however, those labels can identify experiences rather than assigned interventions. The first question is therefore about how someone enters a group. A group formed before observation and a group defined by something that happens later can contain different kinds of information. Reading the label alone cannot establish which comparison has been made, even when both groups appear inside a well-designed trial.
To see the distinction, imagine a hypothetical study in which people receive an assigned treatment and subsequently record their experiences. An editor could sort those records by whether an event appeared, by when it appeared, or by how long it lasted. Each sorting rule would answer a different descriptive question without changing the original treatment assignment. Association asks whether recorded characteristics occur together. A mechanism asks how changing one process would alter another. Prediction asks how accurately information available now forecasts a later outcome. These questions require different evidence, although a short headline can make them sound interchangeable.
This distinction matters when reading annual versus monthly commitments: the duration of an agreement supplies no missing scientific comparison. Our interpretation starts with the measurement question, before considering how anyone might use the result.
Randomization does not travel to every subgroup
As a general design principle, random assignment supports comparison of the groups created by that assignment. It does not automatically balance groups created later by an experience. Consider a purely hypothetical causal diagram expressed in words: a background characteristic could influence both a recorded symptom and a later outcome. Sorting on the symptom would then also sort, imperfectly, on that background characteristic. The resulting contrast could contain several pathways at once. This example identifies a possible structure; it does not claim that a particular characteristic explained the published result.
A second hypothetical pathway illustrates why timing matters. Earlier response could influence later behavior, which could influence both symptom reporting and the availability of a measurement. A final subgroup label would compress that sequence into a single category. Adjusting for a measured variable might address one part of the structure while leaving another unresolved. Adding more variables is therefore not, by itself, proof that an observational contrast has become causal. One needs a defensible account of which variables precede which others and why the chosen adjustment answers the intended question.
The table separates three decisions that can otherwise disappear inside the word group. Its distinctions apply to research interpretation generally; they are not additional findings about individual participants. Naming the decision makes it possible to ask what information each comparison preserves.
| Variable | How groups arise | Interpretation limit |
|---|---|---|
| Assigned treatment | Allocation before follow-up | Does not randomize later experiences |
| Reported symptom | Classification during observation | May track other differences |
| Eligible measurement | Rule applied to recorded outcomes | Limits which trajectory is summarized |
One trial arm, two selected means
SURMOUNT-2’s efficacy analysis omitted post-discontinuation and post-rescue measurements; one nausea, vomiting or diarrhea event defined the subgroup. Repeated-measures modeling produced least-square means. Lilly funded the study.
The figure provides a concrete setting for a broader arithmetic distinction. Percentage change uses starting weight as the reference for each person’s change. A negative sign indicates a decrease relative to that reference; it is not a percentage of participants achieving a particular outcome. A summary of individual percentage changes also need not equal the percentage change calculated from two group-average weights. Those calculations place the averaging operation in different positions. Their equality would require additional conditions, not simply the use of the same unit.
A modeled mean adds another layer: the estimate belongs to a specified statistical model and its target comparison. It should not be read as if every person had the displayed result. Two group summaries can conceal very different spreads, trajectories and combinations of earlier observations. The plotted distance is descriptive information; turning it into the effect of experiencing a symptom would require a separate causal argument. Likewise, a discussion of tirzepatide versus semaglutide raises a between-treatment question that a within-arm grouping does not answer. Keeping these operations separate prevents a change in wording from silently changing the research question.
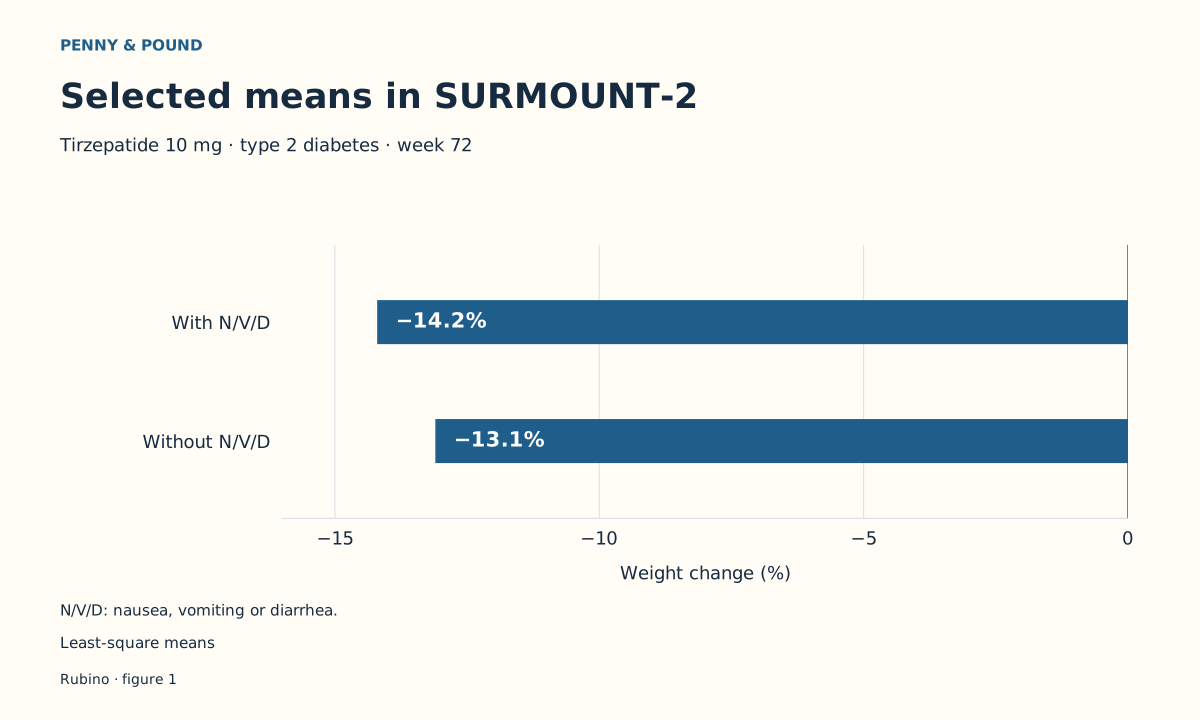
Tirzepatide 10 mg; type 2 diabetes; week 72.
| N/V/D | Weight change (%) |
|---|---|
| With | -14.2 |
| Without | -13.1 |
Why one event can hide different histories
Consider the information lost whenever a detailed record is reduced to a yes-or-no indicator. Two hypothetical records could receive the same positive label even though one contains an early isolated episode and the other contains recurring later episodes. The shared label says that both satisfy the classification rule. It does not establish matching duration, burden or sequence. Conversely, two negative labels can arise from different observation histories. This is a mathematical consequence of compression: many distinct records can map to the same category.
Timing can also determine what a classification could accomplish as a predictor. A label that uses information accumulated through follow-up cannot simply be treated as information available at the beginning. Doing so would let the prediction borrow from its own future. To evaluate an early warning signal, a researcher would need to define a prediction time, restrict the available information to that time, and assess later outcomes separately. That is a different task from describing groups retrospectively. No such prediction performance can be reconstructed from neighboring averages alone.
The practical link to our titration guide is the importance of chronology. A sequence contains information that an ever-or-never category discards. This observation is about how to read records, not a suggested adjustment to anyone’s treatment schedule.
Stopping changes the question behind the result
An estimand is the quantity a study is trying to estimate, described precisely enough to identify the population, outcome, time horizon and handling of intervening events. Suppose a hypothetical analysis asks about outcomes during a specified exposure condition. Another asks what happens after treatment is started, including subsequent changes. Even with identical participants at enrollment, those questions can lead to different eligible records and different interpretations. Neither becomes the other merely because the final outcome carries the same familiar name.
Excluding a measurement is also different from losing contact with its owner. Imagine that a later visit occurs, but the analysis rule leaves its outcome outside a particular calculation. The observation exists, yet it does not contribute to that estimate. Alternatively, a visit might never produce a measurement. Those situations can look similar in a final summary while calling for different information. One requires the inclusion rule; the other requires an account of unavailable data. Treating every exclusion as disappearance from research erases the distinction.
Our guide to stopping a GLP-1 concerns a broader practical question. Scientifically, an answer covering an entire treatment course requires outcomes linked to treatment changes and a clearly stated rule for interpreting them. A selected mean cannot supply that linkage after the fact. The unresolved information belongs in the question, rather than being filled with an assumed favorable or unfavorable trajectory.
Repeated measurements are not replacement observations
Longitudinal observations carry a special structure: measurements from the same person are related. Treating them as unrelated entries would discard that structure and could misrepresent the information available. A repeated-measurement model can represent patterns across visits while accounting for within-person relationships. The useful idea is shared information, not manufactured observation. A fitted pattern summarizes what the recorded data support under the model’s assumptions; it does not turn an unrecorded later value into a directly witnessed outcome.
For a hypothetical example, imagine two analyses of the same incomplete trajectories. One assumes that the recorded history adequately explains which later measurements are unavailable. Another allows unobserved outcomes to influence that availability even after accounting for the history. They can reach different estimates without disagreeing about any recorded value. The disagreement lies in the connection between observed and unobserved information. This is why a precise-looking answer may still depend on an assumption that the data alone cannot settle.
The appropriate response is to ask how the conclusion changes under plausible alternatives, not to declare modeling useless or automatically corrective. Sensitivity analysis makes that dependency visible. To reproduce it, a reader would need the relevant records, model specification and alternative assumptions. Two endpoint summaries do not provide those ingredients. We therefore do not calculate a corrected all-course result or infer an unreported covariance structure from the appearance of a chart.
The comparison that would answer a different question
Different scientific questions need different observation plans. A descriptive association requires clear categories and outcomes. A full-course question requires attention to what happens after relevant treatment changes. A mechanism question requires a defensible causal structure, including which pathways are being isolated and which assumptions connect the available observations to that claim. These are differences in what would count as an answer, not simply demands for a larger sample. More observations of the wrong quantity can leave the original question unresolved.
One useful thought experiment is to imagine receiving perfect follow-up for everyone in a hypothetical study. That improvement could resolve uncertainty about unobserved outcomes, yet it would not necessarily remove confounding in groups defined by later experiences. Conversely, a carefully specified causal comparison could still depend on incomplete outcome measurement. Measurement completeness and causal identification are separate strengths. A reader should ask about each instead of using one as a substitute for the other.
The table makes those requirements explicit. In financial planning, the analogous editorial discipline is to keep the time horizon attached to the question. Our twelve-month cost guide addresses a documentary horizon; this scientific analysis addresses an outcome horizon. Putting both on a calendar does not make a statistical estimate into a forecast of someone’s treatment duration or expenses.
| Question | Evidence needed | Shortcut that fails |
|---|---|---|
| Symptom association | Defined symptom groups and outcomes | Calling association a symptom effect |
| Full course after starting | Follow-up after treatment changes | Treating selected on-treatment means as all-course means |
| Mechanism | A defensible causal design and assumptions | Inferring a mechanism from neighboring averages |
Similar averages do not establish equivalence
Equivalence is a claim about how large a difference can reasonably be, rather than a visual judgment that two bars look close. In a hypothetical equivalence analysis, researchers would specify a margin representing a difference too small to matter for the defined purpose. They would then assess whether the uncertainty around the relevant contrast fits within that margin. Choosing a generous margin after seeing the answer would change the evidentiary meaning. The question and acceptable range must be justified independently of the desired conclusion.
Failure to demonstrate a difference answers another question. An imprecise comparison can be compatible with meaningful differences in either direction. A precise comparison can rule out a wider set of possibilities. Without the appropriate uncertainty for the actual contrast, proximity alone cannot distinguish those situations. Nor should separate group uncertainty summaries be casually treated as the uncertainty of their difference; the relationship between estimates matters. We do not reconstruct a test from the spacing of the displayed values.
Even a well-supported equivalence statement about means would remain a statement about means. Different distributions can share the same center while placing different proportions of observations at their extremes. For a reader, the useful distinction is between a population summary, its uncertainty and the variation among individuals. Each answers something the others leave open. None is recoverable in full from the other two.
Clinical safety stays outside a subgroup shortcut
Zepbound’s current label warns of severe gastrointestinal reactions and kidney injury from volume depletion; it is not recommended with severe gastroparesis. Persistent nausea, vomiting or diarrhea should be reported promptly to the healthcare provider. Compounded GLP-1 drugs lack FDA approval and premarket review for safety, effectiveness and quality.
A benefit summary and a safety decision require different information. A mean describes a defined outcome across a group; clinical assessment concerns a particular presentation, its timing and its possible causes. Even a strong association would not establish that an individual symptom should be tolerated to obtain benefit. Conversely, the absence of a recorded symptom would not by itself measure whether a personal treatment goal has been met. These are limits of the inference, rather than a competing clinical rule.
The same boundary applies to commercial documents. Readers consulting our Gimme Care review should examine dated terms as documents, without treating this trial discussion as a clinical assessment of that provider. A contract, a symptom record and an outcome estimate are different forms of evidence. Combining them requires an explicit question and appropriate evidence for each connection.
How to preserve the unanswered part
A useful reading note can identify three things without pretending to resolve everything: the question represented by the estimate, the information compressed or excluded, and the additional observation that would change its interpretation. That note is more informative than assigning a broad label such as reliable or unreliable. An estimate can answer a narrow question well while leaving an important wider question open. Precision about its scope allows the supported result to remain useful.
Our companion analysis of who contributes a final weight measurement approaches the problem from data coverage. Together, the two perspectives show why a final number needs both an observation rule and an interpretation rule. Coverage describes which information enters. Interpretation describes which conclusions follow. Improving one does not automatically repair the other, and an apparently simple comparison can depend on both.
For future research, the most useful addition would depend on the unresolved question. Linked follow-up could clarify a complete trajectory; a prespecified sensitivity analysis could expose dependence on missing-data assumptions; a suitable causal design could address a mechanism. Those are proposed evidentiary needs, not analyses we performed or results concealed in the existing averages. Keeping that distinction visible preserves room for an answer to change when better evidence becomes available.
Questions
Were participants randomized to have digestive symptoms?
No. The relevant logical distinction is between assigning an intervention and sorting observations by a later experience. The latter comparison needs its own justification before it can support a causal interpretation, even when the surrounding study used random assignment. [2]
Does the plotted gap prove symptoms caused more weight loss?
A gap alone cannot identify its cause. A causal claim requires an account of how the groups would compare under a specified change, with assumptions that separate that change from other pathways. Arithmetic subtraction cannot provide those assumptions. [2]
What happens to observations after treatment stops?
That depends on the question and analysis rule. A later measurement might exist without entering a particular estimate. To understand a whole course of care, ask how subsequent observations are collected, linked and interpreted rather than assuming that every summary covers them. [2]
Does a model make missing observations known?
A model produces estimates under stated assumptions. It can use relationships in available records, but an unobserved outcome remains unobserved. Sensitivity analysis can explore dependence on alternative assumptions; it cannot reveal which hypothetical value actually occurred. [2]
Can someone use these means as a reason to continue or stop?
These summaries do not contain the individual information needed for that decision. A personal choice requires clinical assessment of the relevant goals, history and current circumstances. A subgroup label is not a substitute for that assessment or a personal response test. [2]
Editorial assessment
The strongest interpretation keeps the question attached to the estimate. Group formation, outcome eligibility, statistical modeling and uncertainty each shape what a displayed average means. Our reading does not supply a causal correction or a forecast for an individual. It identifies the additional evidence needed to move from a selected comparison to a broader claim. For a long-term decision, the useful habit is to ask which part of the expected course is actually represented, then leave the rest explicitly unresolved.
Evidence limits
This editorial explanation draws on the full published article and its supplement, with current official safety context. We did not inspect individual participant records or original trial protocols, reconstruct missing outcomes, or perform a new statistical analysis. Hypothetical examples illustrate logic; they are not participant histories. No human medical review is claimed.
Sources
For commercial relationships and editorial standards, see our disclosure and methodology.