Semaglutide in STEP: who contributes a final weight measurement?
Follow-up, medication use and analysis eligibility describe different parts of a long-term treatment study.
AI-assisted editorial analysis of public research. This article has not received independent human medical review. It does not evaluate a provider’s clinical care.
A final weight measurement looks like a simple endpoint: someone steps on a scale, and a number enters a table. Yet a published result also depends on whether that observation qualifies for a particular analysis. Being contacted, taking medication and contributing an eligible measurement are separate states. Treating them as interchangeable can turn an account of available data into an unsupported story about who succeeded, who stopped or who disappeared.
This guide uses a small part of the semaglutide evidence to examine that distinction. The aim is to understand the path from an observation to a result. The explanations and hypothetical examples below are editorial reasoning about measurement, selection and uncertainty. They are not reconstructed participant histories. Following that path helps a reader identify what a long-term claim actually measures before using it to imagine an entire course of care.
Interpretation at a glance
- Observation. An available measurement and an eligible measurement answer different questions. [1]
- Denominator. A proportion needs the population named in its question. [1]
- Selection. Filtering records can change the outcome distribution being summarized. [1]
- Linkage. Separate totals cannot reconstruct individual sequences. [1]
- Assumptions. Sensitivity scenarios explore uncertainty without revealing missing outcomes. [1]
The question starts with the observation
Before interpreting a final result, write the question as a complete sentence. Are we asking what happens after people start a treatment, what happens during a specified period of exposure, or what is observed among records that meet an inclusion rule? These questions can share a medicine and a calendar date while requiring different evidence. The outcome must also be explicit: a weight measurement, a change from starting weight and a decision to continue treatment are different variables.
A useful way to reason about this is to imagine an empty results table. Its column heading says what will be measured; its row heading says whose measurements belong there. A footnote supplies the remaining rule. Changing any of these can change the scientific question even if the table retains the same title. This is why a qualifying phrase deserves attention before the result itself.
The distinction matters when connecting research to a long-term commitment. A defined period of payment is not an observation rule for a health outcome. Our guide to annual and monthly plans concerns a separate documentary question. An inference connecting the two would need an explicit time horizon, an outcome of interest and evidence covering that horizon. A shared word such as year does not provide those connections.
What it means to remain in a study
Consider three yes-or-no entries in a hypothetical research record: contact occurred, medication was taken, and an eligible weight was recorded. None logically determines the other two. A telephone conversation can establish contact without supplying a weight. A weight can be recorded when an exposure requirement is not met. Medication use can be documented while a scheduled measurement is unavailable. These examples explain the possible structure of a record; they do not describe particular trial participants.
The table separates the questions so that a single word, such as retained, cannot quietly answer all of them. Once the statuses are separate, a research report can be examined for the information it actually supplies. A count of contacts needs a contact definition. A count of measurements needs a measurement definition. A count of exposure periods needs an exposure definition. Combining them requires a rule for linking the same people across the same dates.
That linkage is especially relevant to questions about stopping a GLP-1. A question about treatment cessation has a different starting point from a question about research contact. To examine an outcome after a change, the timing of that change and subsequent observation would have to be connected. A total at the end of a table cannot establish the sequence by itself.
| Status | Question answered | Still unknown |
|---|---|---|
| Follow-up contact | Was the person still being observed? | Whether a measurement enters an analysis |
| Medication exposure | Was treatment being taken? | Whether the specified outcome was recorded |
| Analysis eligibility | Does a record meet the stated rule? | What an excluded record would have changed |
A close reading of the two rows
STEP 1’s observed week-68 weights required a dose within the preceding two weeks; groups reflect any gastrointestinal event. Novo Nordisk funded the study.
Read a pair of counts as two descriptions with different eligibility conditions. The first task is to identify what each count includes, rather than to attach a favorable or unfavorable meaning to a shorter bar. Subtracting one count from another is arithmetic. Naming the resulting difference requires additional information. The arithmetic alone cannot distinguish an unavailable observation from a recorded observation excluded by an analytic rule.
This distinction also explains why a chart of observation coverage should not be read as a chart of clinical success. A record can qualify for an analysis regardless of whether its measured outcome is favorable. Conversely, a favorable outcome could exist without a qualifying record. Eligibility concerns the evidence available to an analysis; success requires a defined clinical criterion. Confusing the two replaces an outcome question with a recordkeeping question.
One useful reading exercise is to cover the bar lengths and examine the labels first. Ask what event would make a record enter each column. Then reveal the counts and check whether the proposed interpretation still follows from those entry rules. This order prevents the visual impression of a gap from supplying an explanation that the underlying information does not contain.
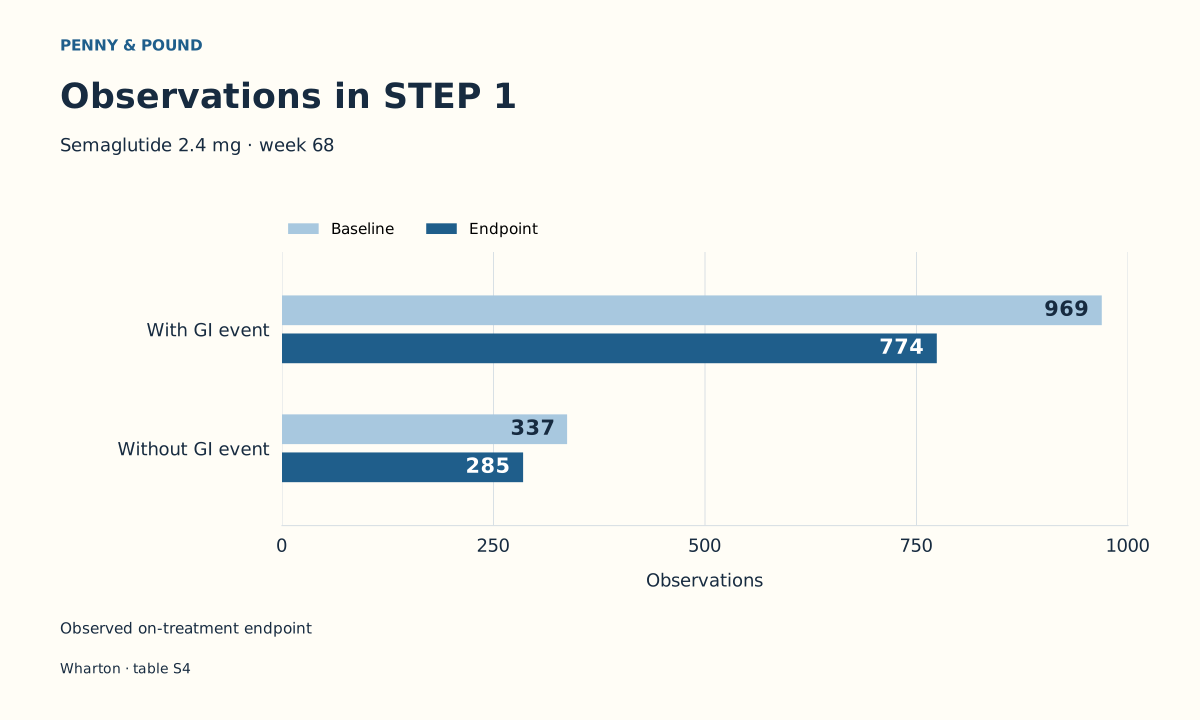
Semaglutide 2.4 mg; week 68; any GI event.
| GI event | Baseline n | Endpoint n |
|---|---|---|
| With | 969 | 774 |
| Without | 337 | 285 |
Why a blank cell has no single explanation
Imagine three possible records in a hypothetical study. In the first, a final weight is recorded after medication exposure has ended, and an analysis requires current exposure. In the second, no weight is obtained at the intended visit. In the third, a measurement exists but falls outside the analysis window. Each could leave the same analysis cell empty, although the underlying information and reason are different.
The first situation raises a question about eligibility: another analysis might use the recorded value. The second raises a question about an unobserved outcome: there may be no value to reuse. The third raises a timing question: a nearby measurement might answer a different endpoint question. These are possibilities for understanding data structure, not explanations assigned to the people behind the displayed counts. Their practical importance is that they call for different additional evidence.
Even an exposure record needs a clear definition of time. A reader can use the titration guide to identify terminology, while keeping an analytic window separate from a personal dosing decision. For research interpretation, the relevant question is whether dates and eligibility rules align. A sequence of exposure changes and visits is more informative than separate totals because it reveals which condition applied when a measurement was made.
Keeping the denominator attached
A proportion is a sentence compressed into arithmetic. Its numerator identifies the event or status being counted; its denominator identifies the population in which that event or status is being considered. If E represents eligible endpoint records and B represents baseline records for the same defined group, E divided by B describes coverage relative to that starting set. It does not become the probability of benefit simply because it is expressed as a percentage.
The same numerator can answer a different question when the denominator changes. Dividing eligible records by people contacted asks about eligibility among contacts, provided those sets and dates are properly linked. Dividing by all people assigned to a treatment asks a broader coverage question. Neither denominator can be substituted casually. The result must retain the population named in its definition, or the numerical precision will conceal a change in meaning.
Comparing groups also requires matching definitions before comparing fractions. Different starting group sizes do not make one group more successful or more persistent. The relevant comparison depends on what is counted and why. This discipline applies when reading a twelve-month cost discussion: a financial total needs its own denominator and covered period. An observation-coverage proportion supplies neither a clinical-success rate nor a conversion factor for a personal budget.
When selection can change a mean
Here is a qualitative thought experiment. Imagine a set of outcomes arranged from lower to higher values. Remove observations evenly across the range, and the remaining average may resemble the original average. Remove observations mainly from one end, and the remaining average can shift. The direction of that shift depends on which values are removed. The exercise illustrates selection; it does not establish that either pattern occurred in a particular study.
Missingness descriptions formalize different versions of that problem. Missing completely at random means the chance of being missing does not depend on observed or unobserved values. A conditional explanation allows missingness to depend on information that has been recorded. Outcome-dependent missingness allows an unobserved outcome itself to remain relevant after that information is considered. These are alternative assumptions about a data process. A count of absent records does not select the correct assumption.
The distinction matters before comparing two averages, including when reading tirzepatide and semaglutide comparisons. Similar observation rules do not prove similar selection processes, and different rules do not reveal how large any distortion would be. To move from possibility to an estimate, an analyst needs relevant measurements and a justified model. Merely knowing that selection is possible supplies neither a corrected result nor the direction of a correction.
What another measurement would resolve
Additional data are useful when they distinguish explanations that otherwise look identical. A visit record could separate an unperformed assessment from an assessment that produced a value. An exposure record could show whether a recorded measurement satisfied a specified condition. A reason for exclusion could clarify why available information was not used. These records answer different questions, so collecting more of one type does not automatically replace another.
Individual linkage is the next requirement. Suppose a dataset contains separate totals for contacts, exposure changes and measurements. The totals alone do not say whether the same people appear in each set. Connecting entries by participant and date would permit a description of sequences. Without that connection, even a detailed collection of margins can leave multiple compatible explanations. The information missing from the summary may be the relationship between records, rather than another overall count.
The second table describes what each additional distinction would clarify. It is a guide to evidence requirements, not a request to infer private histories from public summaries. Even linked records would not automatically explain causation. They could establish timing and eligibility more clearly, while reasons for a change might still need careful measurement. The gain is a more precise description of what happened before attempting to explain why it happened.
| Missing distinction | Information needed | What it would clarify |
|---|---|---|
| Unobserved versus excluded | Visit and inclusion records | The reason an outcome is absent from a result |
| Exposure versus contact | Linked dates and statuses | Whether follow-up continued after treatment |
| Selection versus outcome | Outcomes with prespecified sensitivity assumptions | How much a conclusion depends on eligibility |
An assumption is part of an estimate
When an outcome is unobserved, an analyst cannot inspect it directly. A sensitivity analysis instead asks how a conclusion behaves under alternative assumptions about the information that is unavailable. The alternatives must be tied to a defined target: whose outcome, at which time, under which treatment question. Otherwise, a change in the answer might reflect a change in the question rather than a test of the same conclusion.
Imagine comparing an assumption that absent outcomes resemble comparable observed outcomes with an assumption that they tend to be less favorable. That comparison can reveal dependence on the assumption. It does not tell us which scenario occurred. A plausible scenario needs justification, and a broad range of scenarios can still omit the true pattern. Robustness means a conclusion persists across the scenarios examined; it is not proof that every relevant uncertainty has been removed.
Counts alone are insufficient for constructing a useful numerical sensitivity result about weight change. The analysis would need information about outcomes, relevant predictors, the target population and the assumed relationship between observed and unobserved records. This guide therefore does not manufacture an adjusted efficacy estimate or a tipping point from observation totals. The scientific lesson is that assumptions belong beside the estimate, where readers can see how they contribute to the answer.
Safety questions need their own evidence
Current Wegovy labeling describes potentially severe gastrointestinal reactions, kidney injury associated with volume depletion and delayed gastric emptying. It does not recommend Wegovy for severe gastroparesis. Clinical assessment belongs with a qualified clinician and current prescribing information.
FDA says compounded GLP-1 drugs lack FDA approval and its premarket review of safety, effectiveness and quality.
An analysis inclusion rule is not a symptom assessment. In logical terms, qualifying for a measurement set establishes a relationship between a record and a rule. It does not establish that an experience was harmless, that a symptom had a particular cause or that continuing treatment was appropriate. Answering those questions requires clinical information that the inclusion decision does not encode. This is why a favorable interpretation of observation coverage cannot serve as reassurance about an individual concern.
The same limit applies to commercial documents. Our Gimme Care review provides a place to examine dated terms. A contract describes obligations and conditions; a study measurement describes a research outcome. Neither document acquires the other’s meaning because both concern treatment over time. Connecting a provider to trial findings would require separate evidence about the product, population and care being discussed. The observation chart supplies no such validation.
A clearer way to read a long-term claim
A useful reading method starts by separating three layers. First identify the target question: the population, outcome and horizon. Next identify the observation rule: which records qualify and which do not. Finally identify the inferential step: what assumptions connect the available records to the population named in the question. A conclusion becomes easier to assess when each layer is visible rather than folded into a single phrase such as long-term results.
Then ask what would change your interpretation. A missing definition calls for clearer wording. A missing relationship between records calls for linked information. An unobserved outcome calls for an explicit uncertainty analysis. These gaps require different responses, and their presence does not make every result meaningless. It makes the scope of a result more specific. A well-defined answer to a narrow question can be useful without being enlarged into an answer about an entire treatment experience.
The companion guide on tirzepatide symptom-group averages develops a related distinction between how a group is formed and what its summary can establish. Together, the two questions encourage a disciplined reading habit: preserve the description of the evidence before adding an explanation. If the missing step cannot be supported, leave it visible. An unanswered question is more informative than a confident conclusion created by changing the meaning of a count.
Questions
Does an absent endpoint record mean someone left the study?
No. Absence from an analysis and absence from research contact are different statuses. To connect them, a reader would need a definition of participation, a definition of eligibility and linked records showing which status applied. A single margin cannot establish that sequence or identify the reason behind it. [1]
Can these counts measure clinical success?
A clinical-success measure needs a defined outcome and a rule for deciding whether that outcome meets a criterion. Counting eligible observations does neither. The distinction is between having information that qualifies for analysis and what that information says about benefit. A record can satisfy the first condition without satisfying the second. [1]
Why not divide by everyone who was contacted?
That denominator would ask about eligible records among contacts, assuming matching people and dates. It would not answer the same question as coverage relative to a defined starting group. Choose the denominator from the question first, then calculate. A convenient total is not necessarily the population the result needs to describe. [1]
Can a sensitivity analysis recover the actual missing outcomes?
It can examine what alternative assumptions would imply. It cannot turn those assumptions into observations. Its value is showing whether a conclusion depends strongly on choices about unavailable information. The scenarios, their justification and the target question should therefore remain visible alongside any resulting estimate. [1]
What information belongs with a long-term treatment claim?
Name the population, outcome and follow-up horizon; state which observations enter the analysis; explain treatment changes relevant to the question; and identify how unavailable information is handled. Those details allow readers to distinguish a measured result from a broader inference. They also show which additional evidence could materially change the interpretation. [1]
Editorial assessment
The most useful interpretation preserves the boundary between a person’s course through research and a record’s path into an analysis. Observation counts can illuminate the second without fully describing the first. Reading the eligibility rule, keeping the denominator attached and asking what linked information is missing makes that boundary concrete. Where the available evidence leaves several explanations possible, choosing one is an additional inference. A careful account states what would support that inference instead of treating an unexplained difference as its proof.
Evidence limits
This explanation uses the primary article and its actual supplement. No individual participant data or original trial protocols were inspected. Hypothetical examples and conceptual tables illustrate measurement logic; they are not additional findings from the trial. This is editorial analysis, not a personal treatment recommendation or a claim of human medical review.
Sources
For commercial relationships and editorial standards, see our disclosure and methodology.